
How accurate are homebrew hydrometers and refractometers?
Every summer, me and a friend make sparkling elderflower wine. We pick the flowers when they just start to bloom, add them to sugar, water, lemon, and yeast, and let it ferment. To estimate the progress of the fermentation, the potential for carbonation, and the alcoholic contents, one measures the sugar content of the drink.
There are two main tools for this: a refractometer and a hydrometer. Both are quite cheap. But are they any good? This post describes a calibration effort to check their accuracy.
The data collection and initial draft for this post were done by me, a human. I also did the final proofing and editing. I let Claude Code do some of the work in writing the post, and I hope it didn’t hallucinate and fool me in the process.
The instruments
I tested four instruments:
- Chinese hydrometer — a glass tube hydrometer, calibrated at 60/60°F (about 15.6°C). Reads specific gravity (SG) directly.
- American hydrometer — glass tube, calibrated at 20°C. Comes with a temperature correction table. Reads SG.
- German hydrometer — glass tube, calibrated at 20°C. Reads in Oechsle (°Oe), which converts to SG by \(\text{SG} = 1 + \text{°Oe}/1000\).
- Refractometer — a handheld optical refractometer with automatic temperature compensation (ATC). Reads SG on one of its scales. Zero-point calibrated with tap water at 20°C.
All three hydrometers are the classical kind: a sealed glass tube with a paper scale inside and some metal bead ballast at the bottom. You read the SG off the scale at the lower meniscus of the liquid surface. The different calibration temperatures matter — see my post on hydrometer temperature correction for the physics.
Making reference samples
To calibrate these instruments, I need samples with a known sugar content. I made these by dissolving granulated sugar (sucrose) into tap water, step by step.
The procedure: start with a bowl of water, weigh it, take a sample, measure it with all four instruments, pour the sample back, add a known mass of sugar, dissolve, repeat. I weighed everything with a Hario coffee scale with 0.1 g resolution. Two independent series were prepared — series A with 9 data points and series B with 4 data points, covering a range from 0 to about 26 Brix.
The sugar content is reported in Brix (percent sugar by weight). Since each sampling step removes a small amount of solution, the batch mass changes between steps. I weigh the batch before each sugar addition, so the Brix is computed recursively: at each step, the sugar already in solution is the batch mass times the previous Brix, plus the newly added sugar, divided by the new total mass. This accounts for any sampling losses automatically.
Raw data
Here is the full dataset. Temperature was measured with a digital thermometer. The four SG columns are raw, uncorrected readings from each instrument. The German hydrometer reads in Oechsle; I converted to SG via \(\text{SG} = 1 + \text{°Oe}/1000\). The Brix column is calculated from the cumulative sugar additions, and the reference SG comes from the NBS table.
Series A (starting batch: 178 g tap water)
| # | Temp (°C) | Chinese SG | American SG | Refractometer SG | German SG | Brix | Ref. SG |
|---|---|---|---|---|---|---|---|
| 1 | 25.0 | 0.994 | 1.004 | 1.000 | 1.002 | 0.0 | 1.000 |
| 2 | 22.9 | 0.998 | 1.008 | 1.003 | 1.007 | 1.3 | 1.005 |
| 3 | 23.7 | 1.007 | 1.016 | 1.010 | 1.015 | 3.0 | 1.012 |
| 4 | 24.4 | 1.012 | 1.020 | 1.016 | 1.021 | 4.6 | 1.018 |
| 5 | 25.3 | 1.020 | 1.025 | 1.022 | 1.028 | 6.2 | 1.024 |
| 6 | 25.7 | 1.028 | 1.034 | 1.032 | 1.037 | 8.6 | 1.034 |
| 7 | 25.6 | 1.048 | 1.052 | 1.051 | 1.054 | 13.2 | 1.053 |
| 8 | 25.0 | 1.076 | 1.080 | 1.080 | 1.084 | 19.8 | 1.082 |
| 9 | 24.9 | 1.102 | 1.106 | 1.105 | 1.109 | 25.7 | 1.109 |
Series B (starting batch: 265.5 g tap water)
| # | Temp (°C) | Chinese SG | American SG | Refractometer SG | German SG | Brix | Ref. SG |
|---|---|---|---|---|---|---|---|
| 1 | 21.3 | 0.996 | 1.005 | 1.000 | 1.003 | 0.0 | 1.000 |
| 2 | 24.8 | 1.036 | 1.042 | 1.040 | 1.048 | 10.4 | 1.042 |
| 3 | 25.6 | 1.069 | 1.072 | 1.073 | 1.075 | 18.0 | 1.074 |
| 4 | 25.7 | 1.098 | 1.102 | 1.104 | 1.108 | 25.0 | 1.106 |
The SG values in the table are as read directly from each instrument, with no corrections applied. Note that the Chinese hydrometer consistently reads lower than the others.
The reference values
To convert my known Brix values to reference SG values, I used the NBS (National Bureau of Standards) table of apparent specific gravity of sucrose solutions at 20°C/20°C. These are well-established reference values from Circular 440. The ICUMSA SPS-3 report has more modern tables, but costs $35, and the NBS values are good enough for this purpose.
Raw results
Here is how each instrument performed against the reference, with no corrections applied:
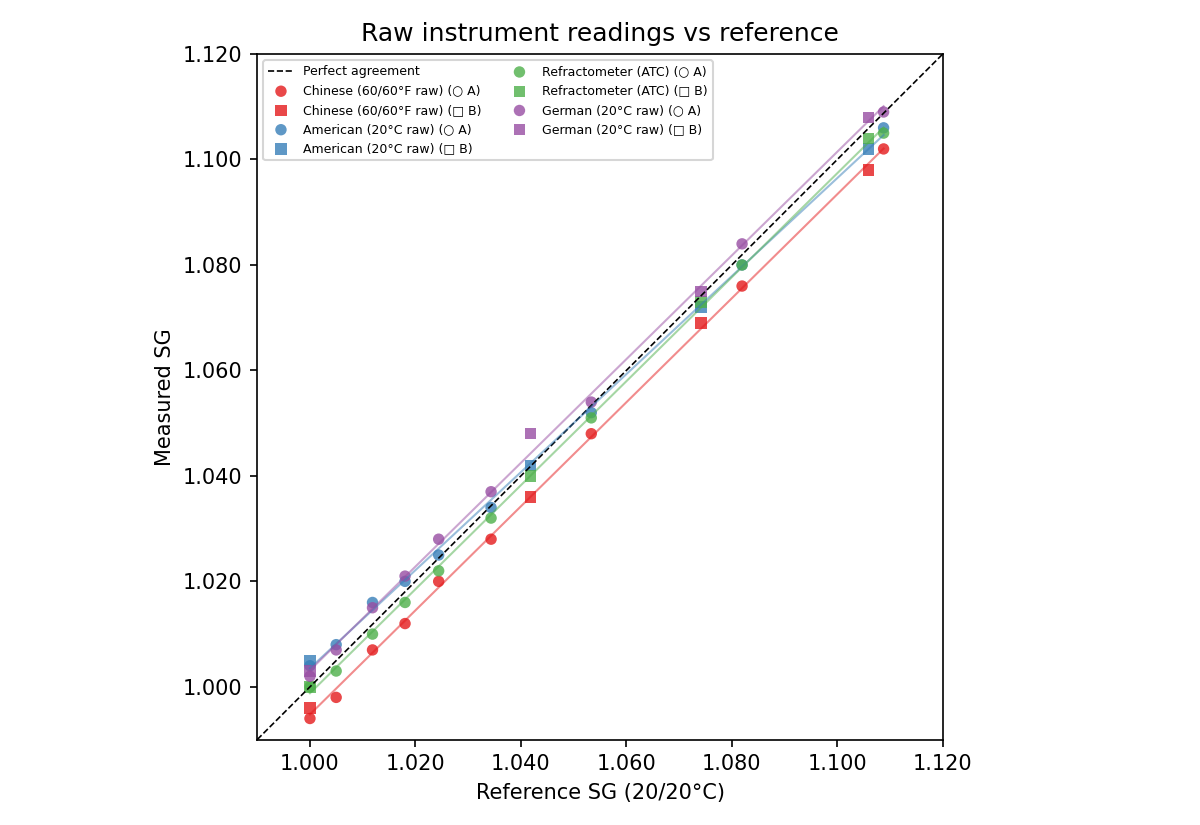
At this scale, everything looks pretty good — all instruments track the reference well. But the interesting question is: how large are the errors? Let’s look at the residuals.
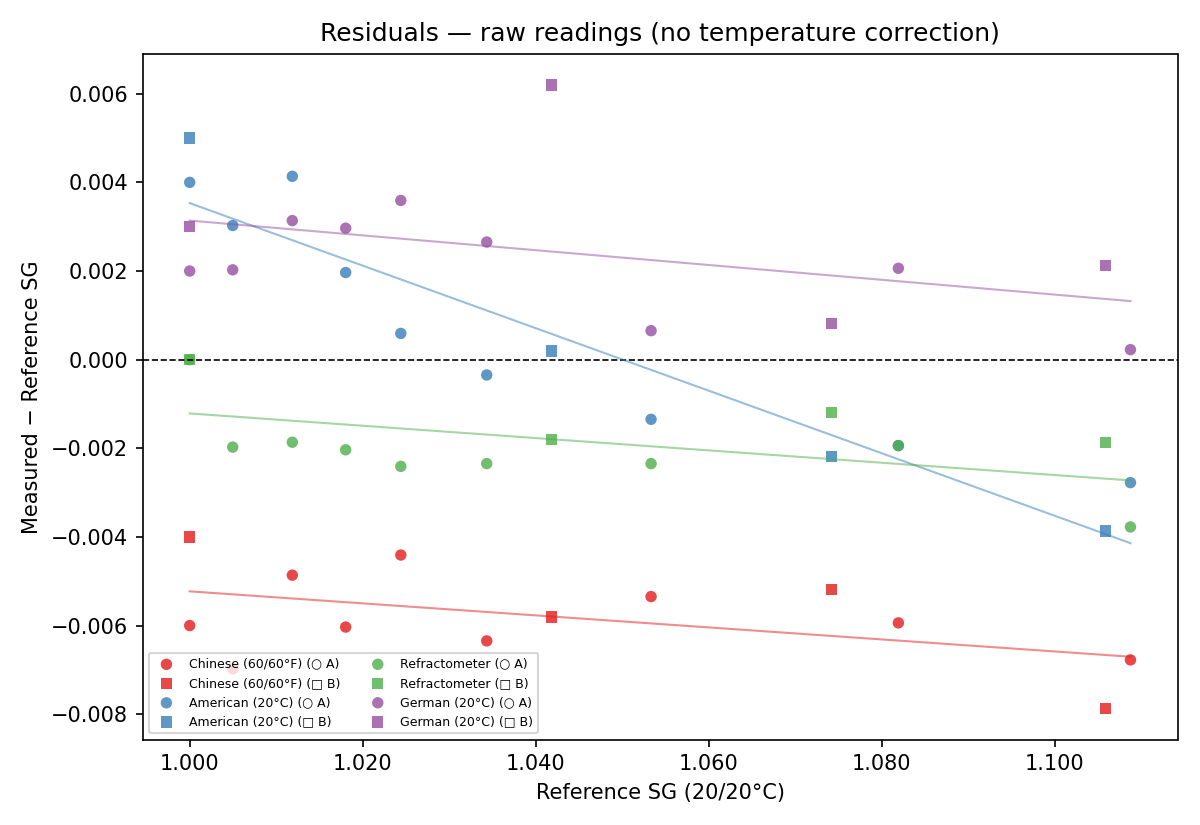
Several things stand out:
-
The Chinese hydrometer reads consistently low, with a mean bias of about −0.006 SG. The 60/60°F → 20/20°C scale conversion only accounts for about 0.001 of this — the rest is some other systematic error.
-
The American and German hydrometers read slightly high, especially at low SG values. They share a similar pattern of positive bias at low concentrations that shrinks at higher concentrations.
-
The refractometer is the most accurate instrument overall, with the smallest spread around zero.
-
All instruments show errors in the range of ±0.002 to ±0.008 SG. Since we read SG to three decimal places (e.g. 1.050), these errors are right at the limit of what the scale can resolve.
After temperature corrections
What happens when we apply the physics-based temperature correction to all three hydrometers? Each reading is multiplied by \(\rho_{\text{water}}(T_{\text{cal}}) / \rho_{\text{water}}(T_{\text{sample}})\), using the actual measured temperature for each sample. The refractometer has ATC and stays as-is.
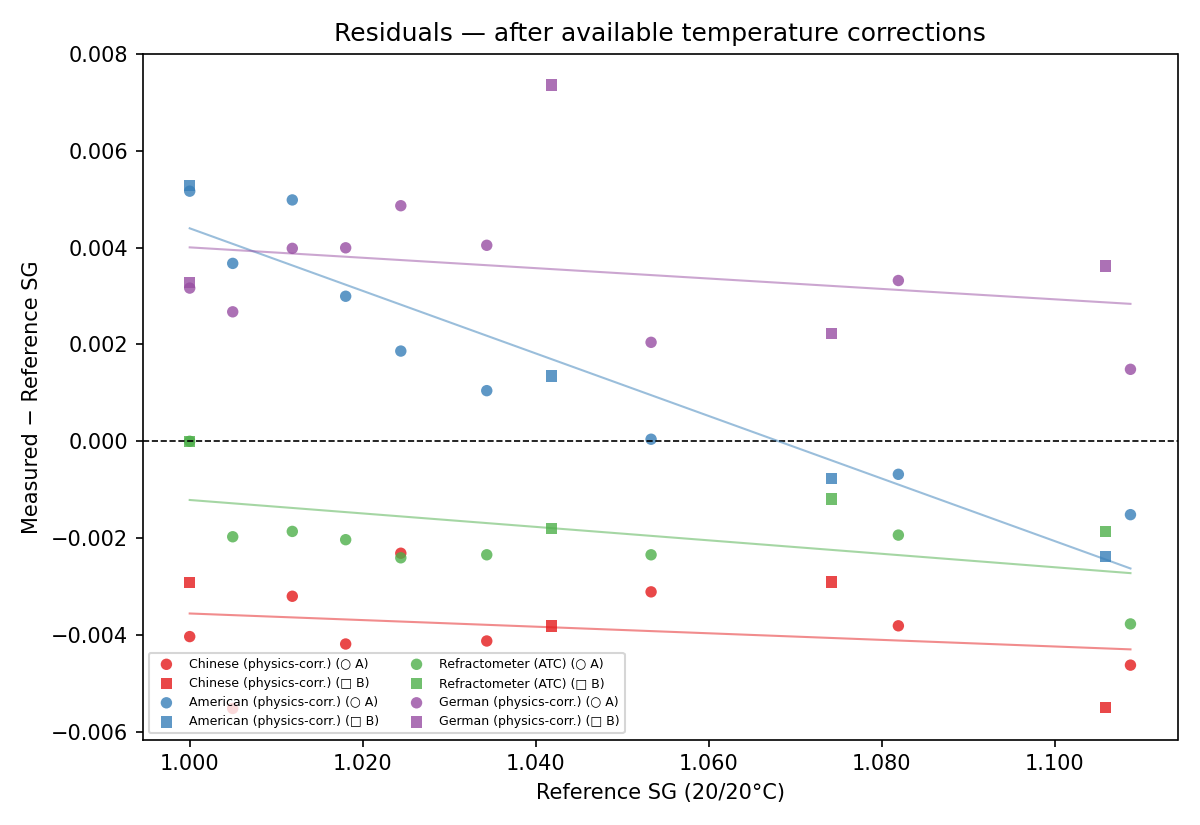
The corrections help the Chinese hydrometer significantly — its RMSE drops from 0.006 to 0.004, and the mean bias shrinks from −0.006 to −0.004. The 60/60°F calibration temperature means it gets a larger correction factor (the water density difference between 15.6°C and 25°C is bigger than between 20°C and 25°C).
But for the American and German hydrometers, the correction makes things worse. The American goes from RMSE 0.003 to 0.003 (unchanged), while the German goes from 0.003 to 0.004. Both already read slightly high, and the correction pushes readings further upward. This tells us that the dominant error source for these instruments is not temperature — it’s something else, likely meniscus reading ambiguity. Reading the lower meniscus versus the upper meniscus on a hydrometer can easily shift the reading by 0.001–0.004 SG.
For comparison, the American hydrometer’s manufacturer correction table makes things even worse (RMSE 0.004). This is unsurprising: the table is calibrated for beer wort, not sucrose solutions. Beer wort contains sugars, proteins, and hop compounds that give it a different thermal expansion than a pure sucrose–water mixture. As discussed in the companion post, the manufacturer corrections are 1.6–2.4× larger than what pure water physics predicts, consistent with the OIV finding that correction tables must be matched to the liquid being measured.
Summary of accuracy
| Instrument | Mean error | RMSE | Max |error| |
|---|---|---|---|
| Chinese (raw, 60/60°F) | −0.006 | 0.006 | 0.008 |
| Chinese (physics-corrected) | −0.004 | 0.004 | 0.006 |
| American (raw, 20°C) | +0.001 | 0.003 | 0.005 |
| American (physics-corrected) | +0.002 | 0.003 | 0.005 |
| American (table-corrected) | +0.003 | 0.004 | 0.007 |
| Refractometer (ATC) | −0.002 | 0.002 | 0.004 |
| German (raw, 20°C) | +0.002 | 0.003 | 0.006 |
| German (physics-corrected) | +0.004 | 0.004 | 0.007 |
The refractometer is the clear winner, with about two thirds the error of the best hydrometer. Among the hydrometers, the American and German are comparable, while the Chinese lags behind.
How much does this matter for ABV?
A common homebrewing technique is to estimate alcohol by volume (ABV) from the drop in specific gravity during fermentation:
\[\text{ABV} \approx 131.25 \times (\text{OG} - \text{FG})\]where OG is the original gravity before fermentation and FG is the final gravity after. If both measurements have independent errors of magnitude \(\delta\) in SG, the ABV error propagates as:
\[\Delta\text{ABV} \approx 131.25 \times \sqrt{2} \times \delta\]But what should we use for \(\delta\)? If you use the same instrument for both OG and FG — which you normally would — then any systematic bias cancels in the subtraction. A hydrometer that consistently reads 0.005 low will read both OG and FG 0.005 low, and the difference OG − FG is unaffected. Only the random scatter (standard deviation) contributes to ABV uncertainty.
| Instrument | Bias | Std dev | ABV error |
|---|---|---|---|
| Chinese (raw) | −0.006 | 0.001 | ±0.2% |
| American (raw) | +0.001 | 0.003 | ±0.5% |
| Refractometer | −0.002 | 0.001 | ±0.2% |
| German (raw) | +0.002 | 0.002 | ±0.3% |
This changes the picture considerably. The Chinese hydrometer has the largest total error (RMSE 0.006) but the smallest random scatter — its error is almost entirely a consistent offset. For ABV estimation, it performs as well as the refractometer. The American hydrometer, despite having the smallest bias, has the most scatter and gives the worst ABV precision.
A typical elderflower wine might ferment from OG 1.060 to FG 1.000, giving a nominal ABV of about 7.9%. All four instruments give ABV uncertainty within ±0.2–0.5%, which is good enough for most purposes. The caveat is that this assumes the bias is truly constant across the SG range — the residual plots show some instruments have a slope, meaning the bias at OG differs slightly from the bias at FG. This would reintroduce some systematic error, but for typical homebrewing accuracy it is a small effect.
Conclusions
- All four instruments are usable for homebrewing, but they are not interchangeable. Errors of 0.002–0.008 SG are typical.
- The handheld optical refractometer was the most accurate instrument tested, with about two thirds the error of the best hydrometer. Its automatic temperature compensation helps.
- Temperature corrections are real (on the order of 0.001–0.003 SG at typical room temperatures) but are not the dominant error source. Meniscus reading ambiguity and manufacturing tolerances appear to matter more.
- For ABV estimation, systematic bias cancels when using the same instrument for OG and FG. The relevant uncertainty is the random scatter, giving ±0.2–0.5% ABV for all instruments tested.
- If you can only buy one instrument, a refractometer is the better choice. It’s also faster and requires less sample volume.
The Python script used to generate the plots and compute the statistics is available here.
References
-
NBS Circular 440, “Polarimetry, Saccharimetry and the Sugars” (F.J. Bates et al., 1942). Internet Archive. Source of the Brix-to-apparent-SG reference table.
-
For references on the temperature correction method, see the companion post.